When you configure diagnostic settings you have the option to configure more than one thus send the logs and metrics to multiple Log Analytics workspaces. At t he same time Log Alert v2 allows you to scope your alerts not only to Log Analytics workspace but also to a specific resource or resource group. When the scope is a resource that is not the Log Analytics workspace or resource group than the Log Alert automatically finds to which workspace the logs are send and uses the data from there. But what happens if you are sending the logs and metrics to more than one Log Analytics workspace?
Tag: Azure Monitor
Azure Monitor Workspace, Managed Prometheus and Prometheus Alerts via Bicep
Recently Azure Monitor team has introduced Azure Monitor workspace. This is a new resource that is described as "Azure Monitor workspaces will eventually contain all metric data collected by Azure Monitor. Currently, the only data hosted by an Azure Monitor workspace is Prometheus metrics.". So basically this new resource is a store for metrics and in future will also support Azure resource metrics. This is similar to Azure Log Analytics workspace which is store for logs. Of course Azure Log Analytics can also store metrics but Azure Monitor workspace is optimized for the structure of metrics data. We are yet to see full picture of this initiative. Currently Azure Monitor workspace is known also as Azure Monitor managed service for Prometheus (Managed Prometheus). The full documentation on this new feature/service you can find here. As a long time user and expert on Azure Monitor and Log Analytics I wanted to try this feature and test its capabilities. My knowledge on Prometheus and Grafana is very little so I always like to challenge myself with such exercises. This new feature has 3 distinct scenarios:
- Using Prometheus and Grafana only – you do not have to use Log Analytics and Container Insights
- Using Prometheus and Grafana along with Log Analytics and Container Insights
- Use your own Prometheus server and send data to Azure Monitor workspace and visualize it in Grafana. You can use Log Analytics and Container Insights as additional monitoring as well.
Enable Defender for Cloud Auto provisioning agents via Bicep
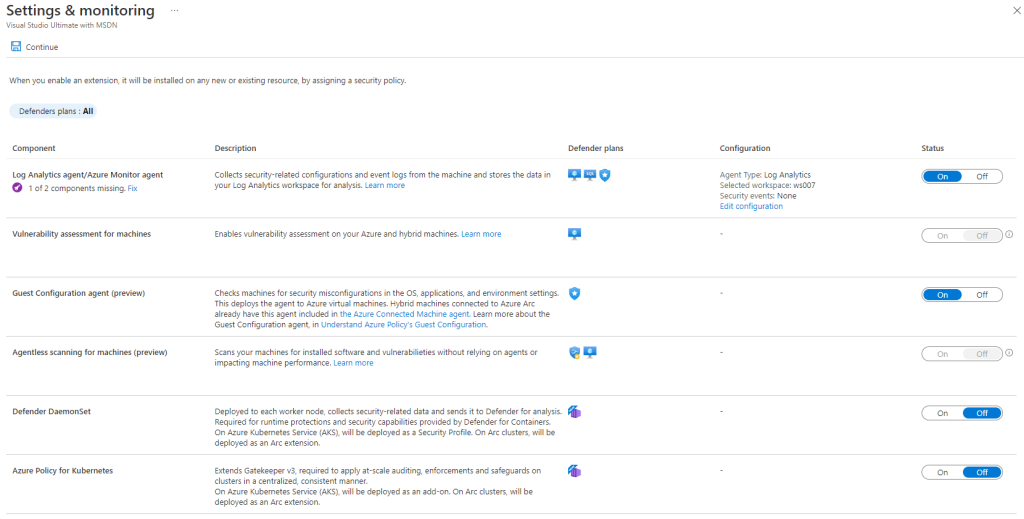
Often I see questions around how I can the auto provisioning agents capabilities (now renamed to Settings & monitoring) in Defender for Cloud via API.

Azure Monitor Log Alert V2
Log Alerts have been available in Log Analytics for quite some time. Initially they were available via legacy Log Alert API that was specific for Log Analytics. In order to make Log Alert more native to Azure a new Log Alert API was available. With a few minor features like (custom webhook payload) that API was direct translate from the legacy one offering the same features. Now Azure Monitor team is introducing a new Log Alert that is named Log Alert V2. That new alert is using the same API but with new version. So if you use the API version 2018-04-16 to create Log Alert you are creating v1 and if you use version 2021-08-01 you are creating v2. Log Alert v2 will be generally available probably very soon as I have received e-mail notification containing the following information:
- any API version like 2021-02-01-preview will be deprecated and replaced by version 2021-08-01
- billing for Log Alert v2 will start from 30th of November.
This for me signals that before 30th of November or several weeks after the service will be generally available. I am not aware of specific information just the official e-mail notification leads me to these conclusions. The Log Alert v2 has been in preview for a couple of months which I have been testing and providing feedback.
Finding Columns that are used by more than one service in AzureDiganostics table
AzureDiagnstics table is used by many Azure Services when you send diagnostic logs thus the 500 column limit that Microsoft is trying to fix for that table. When you hit that limit there is currently the described workaround but let’s say you have used one service that was sending logs and you no longer use that service. The logs associated with that service are yet to purged but you also want to clean up any custom columns that the service was using. That way you can free some slots for new custom columns for new services that will send logs to AzureDiagnostics table. Of course you can delete the custom column from Log Analytics blade but you do not want to delete a custom column that is also used by another service. This will be a short blog post that I will show you how to find if custom column is used by more than one service by using Kusto query language.
