Log Alerts have been available in Log Analytics for quite some time. Initially they were available via legacy Log Alert API that was specific for Log Analytics. In order to make Log Alert more native to Azure a new Log Alert API was available. With a few minor features like (custom webhook payload) that API was direct translate from the legacy one offering the same features. Now Azure Monitor team is introducing a new Log Alert that is named Log Alert V2. That new alert is using the same API but with new version. So if you use the API version 2018-04-16 to create Log Alert you are creating v1 and if you use version 2021-08-01 you are creating v2. Log Alert v2 will be generally available probably very soon as I have received e-mail notification containing the following information:
- any API version like 2021-02-01-preview will be deprecated and replaced by version 2021-08-01
- billing for Log Alert v2 will start from 30th of November.
This for me signals that before 30th of November or several weeks after the service will be generally available. I am not aware of specific information just the official e-mail notification leads me to these conclusions. The Log Alert v2 has been in preview for a couple of months which I have been testing and providing feedback.
So what are the Log Alert v2 new capabilities or changes compared to v1?
- Stateful alert – Let’s say you have some alert that has frequency of 5 minutes and if the threshold is met every 5 minutes you will separate alert instance every 5 minutes. With this new functionality that you can enable you will get one alert instance with state Fired when the threshold is met for first time and once the threshold is no longer met you will receive the same alert instance but with Resolved state. It is important to know that you should enable this feature only for data that is logged on certain frequency in your Log Analytics workspace. For example this feature is useful for data like metrics/performance counters. If your data is based on events that does not have specific defined frequency you should disable it otherwise you will not get desired results.
- 1-minute frequency – You can now have log alert rule that is executed every minute. This is useful if you have critical resources that needs to be monitor in near real time (real time monitoring does not exists as any data send has some latency due to physical laws 🙂 ). Of course usually with such kind of feature it is also good that the time difference between when data is generated and logged to Log Analytics is low as possible like 1-5 minutes.
- New webhook payload – The payload of the webhook is slightly different. This is due to how the alert rule is defined on API level and the new features. One downside compared to Log Alert v1 is that the whole query results are no longer send in the webhook payload. Instead you get direct links to the results by using the Query API. You also get the values from the dimensions that you have defined. More on dimensions later.
- You can scope the alert to specific subscription or resource group instead to Log Analytics workspace – By scoping the alert rule to resource group the rule will apply only to the resource from that resource group. These resources still need to send their data to Log Analytics workspace, the alert rule will take care of making sure it is scoped to data only from those resource. This is useful if you want to apply different thresholds for your alert rules depending on the container (resource group/subscription) of the resources.
- No longer you need to distinguish between metric measurement alert or number of results alert – This is now solved by just defining property in the alert rule that you measure Table rows (number of results) instead of a specific column name (metric measurement) of your results.
- No longer need to define AggregatedValue – you no longer need to define AggregatedValue column in your search query. Basically the whole aggregation no longer needs to be defined in the query as it is controlled by properties on the alert rule. By default there are 5 aggregations supported – Average, Total, Maximum, Minimum and Count. Of course you are still allowed to define your query with aggregation as Kusto query language supports some advanced aggregations like percentile().
- No longer need to define bin() – as aggregation can be controlled by properties of the rules you no longer need to define bin() as well. Of course if you define the aggregation within the query you still have to do that.
- Separate alert instance instance per results – This was possible in v1 as well but was somehow not very discoverable and limited to 3 columns you can define. For example let’s say you have Azure VM for which you monitor the free disk space on each disk. In order to get alert for each VM you want to define _ResourceId column as dimension but if you want to get separate alert instance for each disk on each VM you will need to define the column that contains the name of the disk as dimension as well. These dimensions can also serve as filter to exclude or include certain values. Keep in mind that you do not have limit for how many dimensions you can add but you have a limit of 6000 time-series. Something important to keep in mind is that if you want to add a column of type that is not string (let’s say for example array) it is best to convert it to string in inside the query.
- Setting custom e-mail subject is no longer an option – Custom e-mail subject is no longer an option in v2.
- mute actions should work now per alert instance – I have not checked that but as far as I understood muting should no longer apply for the whole alert rule but it should be per alert instance. This might have been the case for v1 as well but I also haven’t been able to verify it. Note that mute actions cannot be enabled if auto-mitigate (Automatically resolve alerts/Stateful) is enabled.
- queries will now be verified – Kusto queries that you provide in the alert rule will now be verified. For example if in the query rule you are using table or column that do not exists in the Log Analytics workspace the alert rule will fail to deploy. You can disable this feature in case you are deploying an alert which uses data that hasn’t appeared yet in Log Analytics. The verification works only if the alert rule is scoped to Log Analytics workspace and it does not work if it is scoped to subscription or resource group. There are also plugins like bag_unpack that you will not be able to use in queries, instead use parse_json() for example.
- alert rules can be verified for encryption – Basically Log Analytics has option to encrypt alert rules by placing them on your own Azure Storage account. This feature verifies that the alert rule will be placed on custom storage account when deployed.
- Consecutive and Total breaches removed – This option is removed but replaced by Number of violations to trigger the alert. Basically same concept but different way to configure it.
- Billing – The billing is different between v1 and v2. v1 definitely seems more cost effective for at scale monitoring but are also not having the many useful features of v2. At the pricing page Log alert v1 are listed as Log under Alert rules and v2 as At Scale Log Monitoring under Alert Rules. Note that v2 pricing depends on the time series so you must be careful how many dimensions you configure and how many different values you have for those dimensions.
I have not seen any announcement for deprecation of Log Alert v1 at this point so you are free to use them if you find them suitable for your scenarios. I would expect if there is some deprecation announcement in the future to have the standard 3 year in advance notice.
One thing important to note that from feature and billing and later as you will see from API perspective Log Alert v2 looks very similar to Azure Monitor Metric alerts.
Now that we have looked at the differences let’s look at how these two alert rules look from the Portal.
If you got to Log Analytics workspace and execute some query you will see the option to create alert from it.
For Log Alert v1 on configure logic (condition) page you will see the properties that you have seen before:

You will notice that the ability to configure columns for alert instances is not even exposed in the UI.
If we go to a resource group where we have resources sending logs to Log Analytics and we type some query in the Logs blade for the whole resource group we will see different experience that is tied to create Log Alert v2.
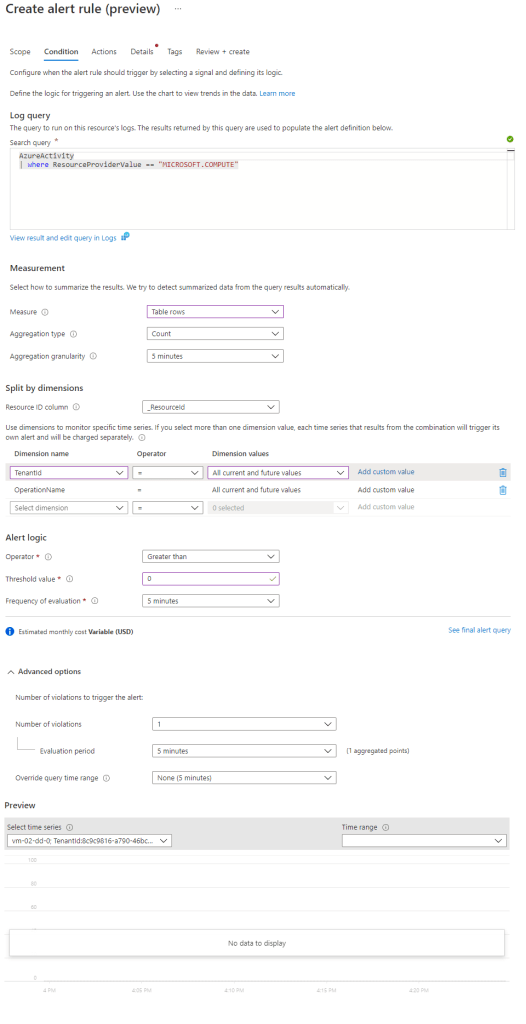
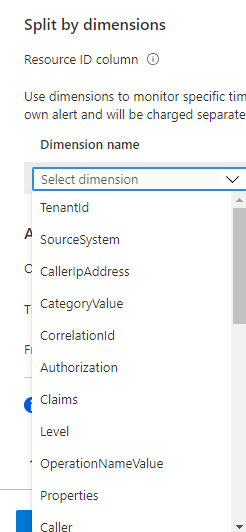
Note that we have defined a query without aggregation and instead of choosing metric measurement or number of results we choose Table rows measure. You can also notice that aggregation is now something we define in the alert rule rather the query. Dimensions are now visible to choose and if you click you can see all the column names you can add as dimensions
Resource ID column option is usually something we choose if the alert is scoped to subscription or resource group. Usually the name of the column that we will choose will be _ResourceId in order to split alert instances for each resource. Act in similar way if you add _ResourceId to dimensions. It is ok if you add it there as well.
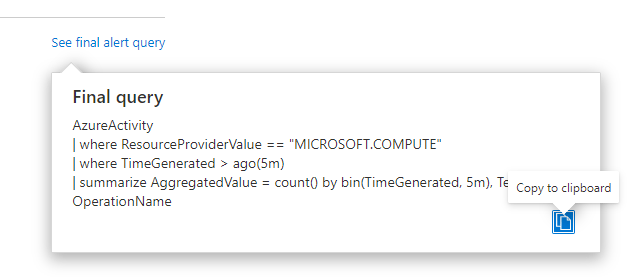
With this new UI experience you also have an option to see how the final query will look. This is the query that will be executed based on how the alert rule is defined.
At the end of the condition you have the advanced options.
For Log Alert v2 when you got to Details tab you will see some of the other new options like Automatically resolve alerts and Check workspace linked storage:
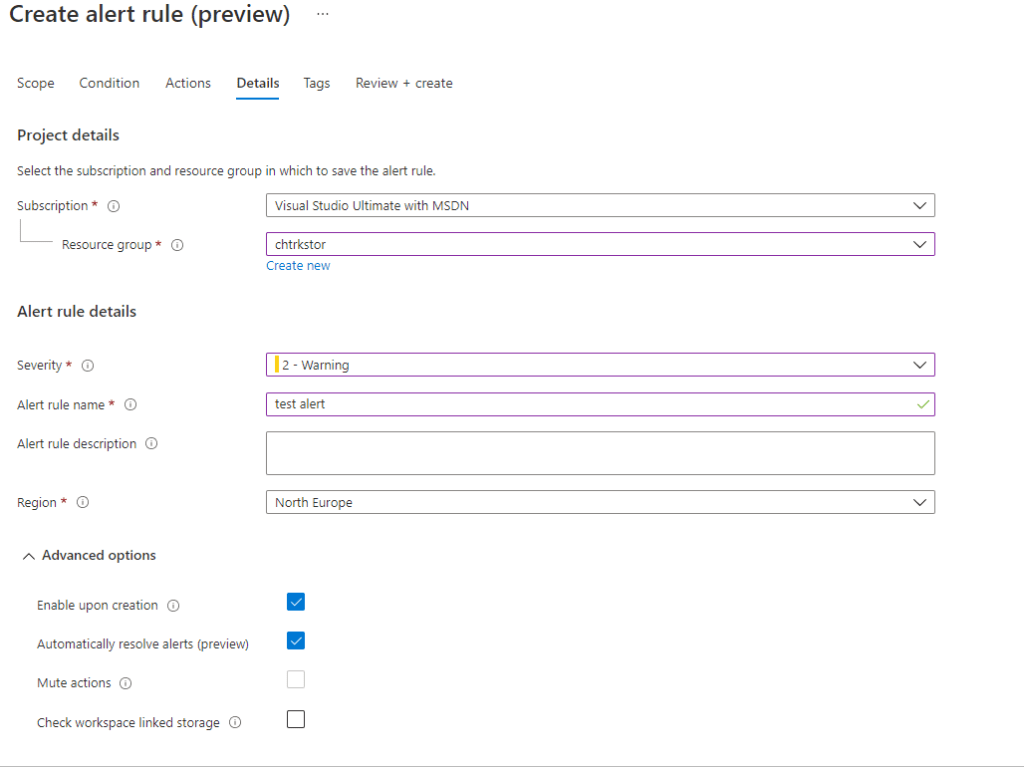
Note that when alert is scoped to resource group or subscription you need to define region. For alerts scoped to workspace the region of the Log Analytics workspace is used. You can read more about the location here.
We took a look from UI perspective and let’s look now from API perspective. For this example I will use Bicep file example instead of ARM one. You can find ARM examples here. As example alerts I will use the ones that I have blogged about before in Azure Monitor Alert Series – Part 7. Let’s start with alert ‘Low Disk space on a volume’:
resource lowDiskCpuAlert 'Microsoft.Insights/scheduledQueryRules@2021-08-01' = {
  name: 'b206bfaf-f760-4aaf-b815-1ff242cea99b'
  location: 'eastus' // should be the location of the Log Analytics workspace if it is scoped to such
  tags: {}
  kind: 'LogAlert'
  properties: {
    displayName: 'Low Disk space on a volume'
    description: 'The volume on a computer is below 10%.'
    enabled: true
    autoMitigate: true // False if auto resolve is not suitable for the log in the query
    severity: 1
    evaluationFrequency: 'PT5M'
    windowSize: 'PT5M'
    muteActionsDuration: null // Another example PT5M
    overrideQueryTimeRange: null
    scopes: [
      // Resource Group scope example
      // '/subscriptions/3045ba70-8cc8-4cdf-949a-ed6122ff68c9/resourceGroups/rg0001'
      // Subscription scope example
      //'/subscriptions/3045ba70-8cc8-4cdf-949a-ed6122ff68c9'
      // Log Analytics scope example
      '/subscriptions/3045ba70-8cc8-4cdf-949a-ed6122ff68c9/resourcegroups/kustotest/providers/microsoft.operationalinsights/workspaces/ws00008'
    ]
    checkWorkspaceAlertsStorageConfigured: false
    skipQueryValidation: false
    actions: {
      actionGroups: [
        '/subscriptions/3045ba70-8cc8-4cdf-949a-ed6122ff68c9/resourceGroups/KustoTest/providers/Microsoft.Insights/actiongroups/mgmtDemo'
      ]
      customProperties: {
        customProperty1: 'value1'
        customProperty2: 'value2'
      }
    }
    criteria: {
      allOf: [
        {
          query: 'Perf | where ObjectName =~ "LogicalDisk" and CounterName =~ "% Free Space" and InstanceName !~ "_Total"'
          timeAggregation: 'Average'
          metricMeasureColumn: 'CounterValue'
          resourceIdColumn: null // null if scope is Log Analytics workspace, _ResourceId if scope is subscription or resource group
          operator: 'LessThan'
          threshold: 10
          dimensions: [
            {
              name: '_ResourceId'
              operator: 'Include'
              values: [
                '*'
              ]
            }
            {
              name: 'InstanceName'
              operator: 'Include'
              values: [
                '*'
              ]
            }
          ]
          failingPeriods: {
            minFailingPeriodsToAlert: 1
            numberOfEvaluationPeriods: 1
          }
        }
      ]
    }
  }
}
In the example I have provided some useful comments but take a note on some of the things:
- For name of the resource I am using GUID but friendly name is defined in displayName property. This is possible for Log Alert v1 as well.
- You will notice that some of the types for different properties have changed. Most notably enable, severity, etc.
- Examples for different types of scoping is provided. Currently you can only scope to one subscription or resource group and multiple workspaces
- I have added an example for custom webhook payload properties
- Most of the main properties of the alert are now within criteria property. Currently you can have only one criteria. For example with metric alerts you can have multiple criteria.
- We aggregated upon _ResourceId and InstanceName columns (defined in dimensions) with Average aggregation on CounterValue column. Each record will be compared to the threshold operator and value.
- As the data from Perf table is send on certain interval auto mitigate is enabled.
- I have not parameterized the Bicep template as it is easy process and the goal is to show you the options in Log Alert v2
The example Bicep code for alert ‘A critical service has stopped’ is:
resource criticalServiceHasStoppedAlert 'Microsoft.Insights/scheduledQueryRules@2021-08-01' = {
  name: 'f04cff8f-caeb-4e31-8c87-d4c840fbe0db'
  location: 'eastus'
  tags: {}
  kind: 'LogAlert'
  properties: {
    displayName: 'A critical service has stopped'
    description: 'A critical service has stopped'
    enabled: true
    autoMitigate: false
    severity: 1
    evaluationFrequency: 'PT5M'
    windowSize: 'PT5M'
    muteActionsDuration: null // Another example PT5M
    overrideQueryTimeRange: null
    scopes: [
      // Resource Group scope example
      '/subscriptions/3045ba70-8cc8-4cdf-949a-ed6122ff68c9/resourceGroups/rg0001'
      // Subscription scope example
      //'/subscriptions/3045ba70-8cc8-4cdf-949a-ed6122ff68c9'
      // Log Analytics scope example
      //'/subscriptions/3045ba70-8cc8-4cdf-949a-ed6122ff68c9/resourcegroups/kustotest/providers/microsoft.operationalinsights/workspaces/ws00008'
    ]
    checkWorkspaceAlertsStorageConfigured: false
    skipQueryValidation: false
    actions: {
      actionGroups: [
        '/subscriptions/3045ba70-8cc8-4cdf-949a-ed6122ff68c9/resourceGroups/KustoTest/providers/Microsoft.Insights/actiongroups/mgmtDemo'
      ]
      customProperties: {
        customProperty1: 'value1'
        customProperty2: 'value2'
      }
    }
    criteria: {
      allOf: [
        {
          query: 'ConfigurationChange | where ConfigChangeType =~ "WindowsServices" and SvcChangeType =~ "State" and SvcState =~ "Stopped" | where SvcDisplayName in ("Computer Browser", "DHCP Client", "Server", "Windows Event Log", "Windows Firewall",  "Remote Procedure Call (RPC)", "Workstation" ) | summarize arg_max(TimeGenerated, *) by _ResourceId, SvcDisplayName'
          timeAggregation: 'Count'
          metricMeasureColumn: null // null for Table Rows option
          resourceIdColumn: '_ResourceId' //_ResourceId when scope is resource group, no need to add it to dimensions as well
          operator: 'GreaterThan'
          threshold: 0
          dimensions: [
            {
              name: 'SvcDisplayName'
              operator: 'Include'
              values: [
                '*'
              ]
            }
          ]
          failingPeriods: {
            minFailingPeriodsToAlert: 1
            numberOfEvaluationPeriods: 1
          }
        }
      ]
    }
  }
}
From this example note the following features:
- This is table rows alert so when we alert when the results are greater than 0 thus metricMeasureColumn is null and timeAggregation is Count.
- The query is also reduced here and I still using arg_max() aggregation just to get a single record for each unique _ResourceId and SvcDisplayName pair.
- We are scoping the alert to resource group so we have _ResourceId value for resourceIdColumn property and we are skipping adding _ResourceId to dimensions
- SvcDisplayName is in dimensions so we get separate alert instance for each Azure VM and service name.
- The logs in table ConfigurationChange are send only when there is actual change so they are not being send on frequency thus auto mitigate is set to false.
I hope this gives you a good start at understanding Log Alert v2 and the changes compared to v1. I hope also that if you decide to migrate the examples will help you with that task.

Hi Stanislav! Great article and it really helps folks like me understand how the new API version of log alerts is working. Do you have more information regarding “targetResourceTypes” property? The docs say it’s a list of resource type of the target resource(s) on which the alert is created/updated. For example if the scope is a resource group and targetResourceTypes is Microsoft.Compute/virtualMachines, then a different alert will be fired for each virtual machine in the resource group which meet the alert criteria. Now from your article, this seems it could be done using “resourceIdColumn”. Is this just another way of splitting alerts but making sure at-scale alerting is only happening on specific resource types, e.g. evaluate VMs only? Additionally, when creating new at-scale log alerts from the portal, this property is filled with the respective type like “Microsoft.Resources/subscriptions” or “Microsoft.Resources/subscriptions/resourcegroups”.
https://docs.microsoft.com/en-us/azure/templates/microsoft.insights/scheduledqueryrules?tabs=json#scheduledqueryruleproperties
It is irrelevant if you set resourceIdColumn as far as I understand.
Hi..great article! We magically came across this in our portal and have no clue how we got there or how to find it again.
>>>If we go to a resource group where we have resources sending logs to Log Analytics
Can you provide more detail so we can re-create a V2 alert??
Thanks!
Dreez
From resource group choose logs at the left. paste your query, execute it and you will see an option for creating alert from there.
Hi Stanislav,
It is a good article! I found that 1-minute evaluation frequency is no longer available when I trying to create a new alert rule on Azure portal. I also got error saying “One minute frequency alert rules are not supported in this api-version”(I am using api version 2021-08-01) when I trying to use template. I was searching for posts and update documentation but couldn’t find anything. Hope you could leave some information.
Thanks!
Boyang
As far as I know it is temporarily disabled due to bug. Should be available once it goes GA or before it I guess.
Ah okay, thanks a lot for the update. At least I can refer this to my colleague.
How can i send search results in alert … this is something we need
Results are available in Log Alert v1 but not in Log Alert v2 webhook. If you want to get some results you will need to add the columns in dimensions. The dimension columns needs to be of type string. Of course by adding the columns there it could change the behavior and cost of the alert. Second option with Log Alert v2 is to write your own custom automation (for example logic app, function or automation runbook) that gets triggered by the action group and from the webhook you get URLs to the query API. When the URLs are executed you will get the results from the alert. Keep in mind that you will require some identity to authenticate against the query API. Once you get the results you can forward them to whatever system you have. This all happens with the workflow of the automation solution you choose.
Hello Stanislav,
Great article I was really interested when they would desperate v1 as well as if you can confirm that moving forward v2 will no longer allow custom JSON being added to alerts?
There is no official message about deprecation of v1. Usually deprecation of major features follows 3 years in advance message so you probably have time. Still I would suggest you to use the common json schema and ability to define custom properties via the alert rule which will be in the json payload.
Hi I have created some application insight custom alerts of type log alerts V2 I can see they are getting fired but not able to find them under all alerts. Can you please suggest where I can find them on azure porta?l
Hi,
There are two things alert rules and alert instances. Both can be checked via Azure Monitor blade. Alert instances will be visible when you open Alerts blade in Azure Monitor and Alerts rules are visible when you click on the top bar Alert Rules. Both have certain filters and scopes that might prevent from seeing them. Make sure you have selected the correct scope and filters to see those.
Hi Stanislav,
Thanks for the detailed blog. We were using the custom webhook for sending the alerts to pagerduty for all the fields. With the V2 alert, is custom property same as custom webhook that we can use?
Hi,
It is not the same. I am not completely familiar with PagerDuty and how it integrates but if PagerDutiy does not supports the common alert schema for Azure Monitor alerts I would advise to address that to them. With Log Alert v2 you can define custom properties. When defined these properties will appear in specific part of the common alert schema – https://docs.microsoft.com/en-us/azure/azure-monitor/alerts/alerts-common-schema-definitions#monitoringservice–log-alerts-v2
from the example above:
“properties”: {
“name1”: “value1”,
“name2”: “value2”
},
name1 and name2 will be the custom properties and value1 and value2 will be their values. Keep in mind that you enter only static values for these properties. If PagerDuty cannot support common alert schema I would suggest to use something like Logic App or function to process the payload before sending it to third party system.
Is it still possible to create v1 alerts? I don’t see any option via the portal, and when I export v1 and v2 rules to ARM I don’t actually see any differences between new and old rules, and deploying an exported v1 rule ends up in a v2 rule being created.
Ultimately we would need to rework our webhook processor to support identity so that it can fetch the search results, but that was work I was hoping to not have to do today!
Hi,
I already mentioned in the article:
So if you use the API version 2018-04-16 to create Log Alert you are creating v1 and if you use version 2021-08-01 you are creating v2.
If it is possible via portal I do not know as portal changes. If you want v1 alert rules use ARM with the corresponding API version to make sure you are always creating v1 alert rules.
Export template functionality will not work as it will use the latest API version even if your alert is v2 so when you export the template and re-deploy you will deploy v2 alert. You can click on the alert resource and on top corner you have json view link. Click it and you can see the resource properties when you select specific API version. Select the version for v1 and you will see how the properties of the alert rule looks. From there you can build ARM template on your own with those properties and the API version to deploy v1 alerts.
You’re absolutely right, sorry! I was sure you mentioned that after I read your fantastic article, but couldn’t find it with ctrl-F because I was looking for the wrong thing.
Your View JSON method worked perfectly and this feature was an exciting discovery I’ve never used before – this is much nicer and faster than Export Template for many use cases, which as you said, also does not have the desired result in this case!
My V1 alert is working again – cheers!
yes, json view is also one of my favorite functionalities.
I am using this script and getting error –
New-AzScheduledQueryRule : Exception type: Exception, Message: System.Exception: Error occurred while creating Log Alert rule —> System.AggregateException: One or more errors occurred.
—> Microsoft.Azure.Management.Monitor.Models.ErrorContractException: Operation returned an invalid status code ‘BadRequest’
at Microsoft.Azure.Management.Monitor.ScheduledQueryRulesOperations.d__5.MoveNext()
**Here is Script:-**
$source = New-AzScheduledQueryRuleSource -Query ‘Perf | where TimeGenerated > ago(15m)| where Computer contains “az” and CounterPath contains “(/)” and CounterName contains “% Used Space”| where CounterValue >= 80 | project SmartsVM = Computer,TimeGenerated, Alerts_Title = strcat(“Smarts Linux VM File Parition (“,InstanceName ,”) is over 80% used”),CounterValue | summarize AggregationValue= avg(CounterValue) by bin(TimeGenerated,30m) , SmartsVM, Alerts_Title | project a, SmartsVM, Alerts_Title,AggregationValue
$schedule = New-AzScheduledQueryRuleSchedule -FrequencyInMinutes 5 -TimeWindowInMinutes 2880
$metricTrigger = New-AzScheduledQueryRuleLogMetricTrigger -ThresholdOperator “GreaterThan” -Threshold 1 -MetricTriggerType Total -MetricColumn “AggregationValue”
$triggerCondition = New-AzScheduledQueryRuleTriggerCondition -ThresholdOperator “GreaterThan” -Threshold 80 -MetricTrigger $metricTrigger
$aznsActionGroup = New-AzScheduledQueryRuleAznsActionGroup -ActionGroup “/subscriptions/xxxx” -EmailSubject “Smarts Linux VM Parition Threshold Alerting” -CustomWebhookPayload “{ “alert”:”#alertrulename”, “IncludeSearchResults”:true }”
$alertingAction = New-AzScheduledQueryRuleAlertingAction -AznsAction $aznsActionGroup -Severity “3” -Trigger $triggerCondition
New-AzScheduledQueryRule -ResourceGroupName “xxx” -Location xx-Action $alertingAction -Enabled $true -Description “Smarts Linux VM Parition is 80% over utilized” -Schedule $schedule -Source $source -Name “Smarts Linux VM Parition Threshold Alerting”
Hi,
It is very hard for me to provide you with fix for this issue as there are a lot of variables when using Az PowerShell module like PowerShell version, Az module version, environment (OS), etc. I think also that cmdlet New-AzScheduledQueryRule creates Log Alert v1 rather v2. I can comment on your query though. I would say this is not the right way to build query for Log Alert no matter if it is v1 or v2. A few things to note:
– You are limiting the query time window within the query – ‘where TimeGenerated > ago(15m)’. Avoid doing that. The alert rule provides you with that capability.
– avoid using contains operator. Instead use has. The latter provides better performance.
– avoid defining threshold within the query – ‘where CounterValue >= 80’. The alert has capability to define the threshold
– In general avoid (even when you do query without alerting) when you have aggregation/summarization(| summarize ) avoid defining threshold (‘where CounterValue >= 80’ ) before aggregation is done.
– When you have Log Alert v2 you do not have to define aggregation/summerazation inside the query (| summarize AggregationValue= avg(CounterValue) by bin(TimeGenerated,30m) , SmartsVM, Alerts_Title) as the alert rule allows you to define that. Defining aggregation inside the query when you have v2 alert is only useful if the type of aggregation is not supported by the alert rule. Aggregation of type average is support by v2 rule.
You can see my Azure Monitor alert series which cover examples of Log Alert v1 and this blog post for Log Alert v2.
With all that said I would suggest to use ARM/Bicep Templates to deploy your Log Alerts v1 or v2 as that way you will avoid many of the problems of using New-AzScheduledQueryRule cmdlet.
Hi, Is there is process available where we can migrate the existing V1 alerts to V2 ?
No such functionality is available out of the box. One way is just to move parameters from the old version to the corresponding ones in the new one but I would suggest to re-write where possible as now aggregation can be done in alert rule instead of query as mentioned in article.
Hi,
I am working on creating a custom email template for log analytics alert. As my version is 2021 and monitoring service is log V2, I found that custom template is not possible. The workarounds I got are logic apps and webhooks. Can you please provide a suggestion on this?
Kindly provide if there is any documentation for the same. Thanks in advance.
Hi,
Yes custom e-mail template is no longer available and you will need to use logic app and webhook. There is nothing special about this scenario. You have alert rule which you attach to action group. The action group you configure for Logic App action. Your logic app needs to contain the logic for processing the data coming from the alert to send it to the third party e-mail system. This logic you need to create on your own. The data coming from the alert is documented in common alert schema – https://learn.microsoft.com/en-us/azure/azure-monitor/alerts/alerts-common-schema.
Thank you so much for the info
How can I get the result that generated the alert from your logic app? if it’s through an API, could you give me more details? Like, for example, images explaining the step-by-step? Thank.
How can I get the result that generated the alert from your logic app? if it’s through an API, could you give me more details? Like, for example, images explaining the step-by-step?