Azure Bicep Snapshots is a new preview feature introduced in v0.36.1 release. The feature allows you to generate the definition of a resource as it appears in ARM or in the Azure Portal for that particular resource when you click on the JSON view option, producing a JSON file as the result. Once you have that JSON file you can execute the snapshot command again to get results in what-if format. All this is done locally without doing an actual deployment against Azure. This means you can see how changes either in code or in the input impact your end results without having to deploy resources or make sure any referenced resources exist. This blog post will focus on showing you the capabilities of Bicep Snapshots in a complex real-world module and its bicep parameters configuration.
To demonstrate snapshots I will be using a module that deploys Log Alerts (Microsoft.Insights/scheduledQueryRules resource type). I’m using this resource because Azure has introduced two new features related to it – Log Alert with dynamic threshold and Simple Log Search alert. Both of these features are deployed with the same resource type. Log Alert with dynamic threshold is exactly how it sounds – the previous option only supported static thresholds and the new dynamic threshold provides the same functionality as Metric alerts with dynamic threshold. Basically, Machine Learning (ML) is used to calculate the threshold based on data from previous periods. Overall, this further blurs the line between Log Alerts and Metric alerts and provides consistency between them. Simple Log Search Alert covers a limitation where you cannot use Log Alerts on tables that are under the Basic plan. They also work on the Analytics plan and I hope in the future they will work on the Auxiliary plan. This type of alert, as the name implies, has fewer configuration options and basically evaluates each row individually in the query specified. With that said, we have three main scenarios (cases) with a single resource which is a very good example for demonstrating Bicep Snapshots. Let’s begin by first looking at our bicep module. We have three files that are part of the module:
types.bicep – contains the user-defined data types for our input parameters.
@export()
@discriminator('type')
type logAlert = logAlertStatic | logAlertDynamic | logAlertSimpleLogSearchAlert

type logAlertStatic = {
  @description('The name (id) of the log alert rule.')
  name: string
  type: 'LogAlertStaticThreshold'
  @description('The display name of the log alert rule.')
  displayName: string
  @description('Tags.')
  tags: tags?
  @description('The severity of the alert rule.')
  severity: 0 | 1 | 2 | 3 | 4
  @description('The identity of the alert rule. Default: None.')
  identity: identity?
  @description('The scope of the log alert rule.')
  scope: scope
  @description('The description of the log alert rule.')
  description: string?
  @description('Enables the log alert rule. Default: true.')
  enabled: bool?
  @description('''Makes the log alert rule stateless or stateful. Value true for stateful, false for stateless.
    Use stateful in cases where the log in the query is metric based or it logs data at certain frequency and stateless when the log is event based or it logs data at irregular frequency.
    Default: false (stateless).''')
  autoMitigate: bool?
  @description('The frequency at which the alert rule is evaluated in minutes. Default: 15.')
  frequencyInMinutes: 1 | 5 | 10 | 15 | 30 | 45 | 60 | 120 | 180 | 240 | 300 | 360 | 1440?
  @description('The period of time (in minutes) on which the Alert query will be executed (bin size). Default: 15.')
  windowSizeInMinutes: 1 | 5 | 10 | 15 | 30 | 45 | 60 | 120 | 180 | 240 | 300 | 360 | 1440 | 2880?
  @description('Overrides the query time range (in minutes). Default: null.')
  overrideQueryTimeRangeInMinutes: 1 | 5 | 10 | 15 | 30 | 45 | 60 | 120 | 180 | 240 | 300 | 360 | 1440 | 2880?
  @description('Mute actions for the chosen period of time (in minutes) after the alert is fired. Default: null.')
  muteActionsDurationInMinutes: 1 | 5 | 10 | 15 | 30 | 45 | 60 | 120 | 180 | 240 | 300 | 360 | 1440 | 2880?
  @description('The Kusto (KQL) query for the alert rule.')
  query: string
  @description('Aggregation type.')
  timeAggregation: 'Average' | 'Count' | 'Maximum' | 'Minimum' | 'Total'
  @description('The operator to compare the metric against the threshold.')
  operator: 'Equal' | 'GreaterThan' | 'GreaterThanOrEqual' | 'LessThan' | 'LessThanOrEqual'
  @description('The threshold for the alert rule. For decimal values enter them as string, e.g. "0.5".')
  threshold: any
  @description('Metric measure column. This is the column that contains the metric to be measured against the threshold. Use value TableRows when using Count as time aggregation.')
  metricMeasureColumn: string
  @description('The column containing the resource id. The content of the column must be a uri formatted as resource id. Default: _ResourceId when scope is ResourceGroup or Subscription, otherwise null.')
  resourceIdColumn: string?
  @description('The number of violations to trigger an alert. Should be smaller or equal to numberOfEvaluationPeriods. Default: 1.')
  minFailingPeriodsToAlert: 1 | 2 | 3 | 4 | 5 | 6?
  @description('The number of aggregated lookback points. The lookback time window is calculated based on the aggregation granularity (windowSize) and the selected number of aggregated points. Default: 1.')
  numberOfEvaluationPeriods: 1 | 2 | 3 | 4 | 5 | 6?
  @description('Dimensions to add to the alert rule. Default: empty array.')
  dimensions: dimension[]?
  @description('The flag which indicates whether this scheduled query rule should be stored in storage account. Default: false.')
  checkWorkspaceAlertsStorageConfigured: bool?
  @description('The flag which indicates whether the provided query should be validated or not. Default: false.')
  skipQueryValidation: bool?
  @description('Action groups to be triggered when the alert rule is fired. Default: empty array.')
  actionGroups: actionGroup[]?
  @description('Action properties to configure on the alert rule when an action group is triggered. Default: empty object.')
  actionProperties: actionProperties?
  @description('Custom properties to configure on the alert rule when an action group is triggered. Default: empty object.')
  customProperties: customProperties?
}

type logAlertDynamic = {
  @description('The name (id) of the log alert rule.')
  name: string
  type: 'LogAlertDynamicThreshold'
  @description('The display name of the log alert rule.')
  displayName: string
  @description('Tags.')
  tags: tags?
  @description('The severity of the alert rule.')
  severity: 0 | 1 | 2 | 3 | 4
  @description('The identity of the alert rule. Default: None.')
  identity: identity?
  @description('The scope of the log alert rule.')
  scope: scope
  @description('The description of the log alert rule.')
  description: string?
  @description('Enables the log alert rule. Default: true.')
  enabled: bool?
  @description('''Makes the log alert rule stateless or stateful. Value true for stateful, false for stateless.
    Use stateful in cases where the log in the query is metric based or it logs data at certain frequency and stateless when the log is event based or it logs data at irregular frequency.
    Default: false (stateless).''')
  autoMitigate: bool?
  @description('The frequency at which the alert rule is evaluated in minutes. Default: 15.')
  frequencyInMinutes: 1 | 5 | 10 | 15 | 30 | 45 | 60 | 120 | 180 | 240 | 300 | 360 | 1440?
  @description('The period of time (in minutes) on which the Alert query will be executed (bin size). Default: 15.')
  windowSizeInMinutes: 1 | 5 | 10 | 15 | 30 | 45 | 60 | 120 | 180 | 240 | 300 | 360 | 1440 | 2880?
  @description('Overrides the query time range (in minutes). Default: null.')
  overrideQueryTimeRangeInMinutes: 1 | 5 | 10 | 15 | 30 | 45 | 60 | 120 | 180 | 240 | 300 | 360 | 1440 | 2880?
  @description('Mute actions for the chosen period of time (in minutes) after the alert is fired. Default: null.')
  muteActionsDurationInMinutes: 1 | 5 | 10 | 15 | 30 | 45 | 60 | 120 | 180 | 240 | 300 | 360 | 1440 | 2880?
  @description('The Kusto (KQL) query for the alert rule.')
  query: string
  @description('Aggregation type.')
  timeAggregation: 'Average' | 'Count' | 'Maximum' | 'Minimum' | 'Total'
  @description('The operator to compare the metric against the threshold.')
  operator: 'GreaterOrLessThan' | 'GreaterThan' | 'LessThan'
  @description('The extent of deviation required to trigger an alert. This will affect how tight the threshold is to the metric series pattern.')
  thresholdSensitivity: 'Low' | 'Medium' | 'High'
  @description('Use this option to set the date from which to start learning the metric historical data and calculate the dynamic thresholds (in ISO8601 format).')
  ignoreDataBefore: string?
  @description('Metric measure column. This is the column that contains the metric to be measured against the threshold. Use value TableRows when using Count as time aggregation.')
  metricMeasureColumn: string
  @description('The column containing the resource id. The content of the column must be a uri formatted as resource id. Default: _ResourceId when scope is ResourceGroup or Subscription, otherwise null.')
  resourceIdColumn: string?
  @description('The number of violations to trigger an alert. Should be smaller or equal to numberOfEvaluationPeriods. Default: 1.')
  minFailingPeriodsToAlert: 1 | 2 | 3 | 4 | 5 | 6?
  @description('The number of aggregated lookback points. The lookback time window is calculated based on the aggregation granularity (windowSize) and the selected number of aggregated points. Default: 1.')
  numberOfEvaluationPeriods: 1 | 2 | 3 | 4 | 5 | 6?
  @description('Dimensions to add to the alert rule. Default: empty array.')
  dimensions: dimension[]?
  @description('The flag which indicates whether this scheduled query rule should be stored in storage account. Default: false.')
  checkWorkspaceAlertsStorageConfigured: bool?
  @description('The flag which indicates whether the provided query should be validated or not. Default: false.')
  skipQueryValidation: bool?
  @description('Action groups to be triggered when the alert rule is fired. Default: empty array.')
  actionGroups: actionGroup[]?
  @description('Action properties to configure on the alert rule when an action group is triggered. Default: empty object.')
  actionProperties: actionProperties?
  @description('Custom properties to configure on the alert rule when an action group is triggered. Default: empty object.')
  customProperties: customProperties?
}

type logAlertSimpleLogSearchAlert = {
  @description('The name (id) of the log alert rule.')
  name: string
  type: 'SimpleLogSearchAlert'
  @description('The display name of the log alert rule.')
  displayName: string
  @description('Tags.')
  tags: tags?
  @description('The severity of the alert rule.')
  severity: 0 | 1 | 2 | 3 | 4
  @description('The identity of the alert rule. Default: None.')
  identity: identity?
  @description('The scope of the log alert rule.')
  scope: scope
  @description('The description of the log alert rule.')
  description: string?
  @description('Enables the log alert rule. Default: true.')
  enabled: bool?
  @description('''Makes the log alert rule stateless or stateful. Value true for stateful, false for stateless.
    Use stateful in cases where the log in the query is metric based or it logs data at certain frequency and stateless when the log is event based or it logs data at irregular frequency.
    Default: false (stateless).''')
  autoMitigate: bool?
  @description('The Kusto (KQL) query for the alert rule.')
  query: string
  @description('Minimal number of times in the last minute when the condition is met to trigger an alert. Value 0 for every time the condition is met.')
  minRecurrenceCount: int
  @description('The flag which indicates whether this scheduled query rule should be stored in storage account. Default: false.')
  checkWorkspaceAlertsStorageConfigured: bool?
  @description('The flag which indicates whether the provided query should be validated or not. Default: false.')
  skipQueryValidation: bool?
  @description('Action groups to be triggered when the alert rule is fired. Default: empty array.')
  actionGroups: actionGroup[]?
  @description('Action properties to configure on the alert rule when an action group is triggered. Default: empty object.')
  actionProperties: actionProperties?
  @description('Custom properties to configure on the alert rule when an action group is triggered. Default: empty object.')
  customProperties: customProperties?
}

type tags = {
  @description('The value of the tag.')
  *: string
}

@discriminator('type')
type identity = identitySystemAssigned | identityUserAssigned

type identitySystemAssigned = {
  @description('The type of the identity.')
  type: 'SystemAssigned'
}

type identityUserAssigned = {
  @description('The type of the identity.')
  type: 'UserAssigned'
  @description('The name of the user assigned identity.')
  name: string
  @description('The resource group name of the user assigned identity.')
  resourceGroupName: string
  @description('The subscription id of the user assigned identity. Default: current subscription.')
  subscriptionId: string?
}

@discriminator('type')
type scope = scopeResourceGroup | scopeLogAnalyticsWorkspace | scopeApplicationInsights | scopeSubscription

type scopeResourceGroup = {
  @description('The type of the scope.')
  type: 'ResourceGroup'
  @description('The name of the resource group.')
  resourceGroupName: string
  @description('The subscription id of the resource group. Default: current subscription.')
  subscriptionId: string?
}

type scopeLogAnalyticsWorkspace = {
  @description('The type of the scope.')
  type: 'LogAnalyticsWorkspace'
  @description('The name of the Log Analytics workspace.')
  name: string
  @description('The resource group name of the Log Analytics workspace.')
  resourceGroupName: string
  @description('The subscription id of the Log Analytics workspace. Default: current subscription.')
  subscriptionId: string?
}

type scopeApplicationInsights = {
  @description('The type of the scope.')
  type: 'ApplicationInsights'
  @description('The name of the Application Insights resource.')
  name: string
  @description('The resource group name of the Application Insights resource.')
  resourceGroupName: string
  @description('The subscription id of the Application Insights resource. Default: current subscription.')
  subscriptionId: string?
}

type scopeSubscription = {
  @description('The type of the scope.')
  type: 'Subscription'
  @description('The subscription id. Default: current subscription.')
  subscriptionId: string?
}

type dimension = {
  @description('The name of a column of type string that will be used as dimension.')
  name: string
  @description('The operator.')
  operator: 'Include' | 'Exclude'
  @description('Values of the column to compare. Value * can be used to include any value available in the column.')
  values: string[]
}

type actionGroup = {
  @description('The subscription ID of the action group. Default: current subscription.')
  subscriptionId: string?
  @description('The resource group name of the action group.')
  resourceGroupName: string
  @description('The name of the action group.')
  name: string
}

type actionProperties = {
  @description('The value of the action property.')
  *: string
}

type customProperties = {
  @description('The value of the custom property.')
  *: string
}
A few things to notice in the file:
- We are using the @discriminator() decorator to have a different set of parameters based on the log alert type chosen in the input. You will also notice that I am using that decorator in other places like scope and identity parameters. These act like sub-cases to our initial three that are based on the alert type.
- We are using the new any type for threshold so you can enter either int or string values. The string value can be used for decimal values.
- Every parameter that is not required is another sub-case as for each you can test if the default value is applied correctly when not configured and if the value is provided if the correct one was applied.
File main.bicep serves as a loop to deploy each log alert via its own deployment. It makes the code easier to write when you do not have to loop on the resource and its properties in the same code.
import * as types from './types.bicep'

param logAlerts types.logAlert[]

module logAlertsModule 'log-alert.bicep' = [for (logAlert, index) in logAlerts: {
  name: 'logAlert-${index}'
  params: {
    logAlert: logAlert
  }
}]
File log-alert.bicep contains the main code of deploying the Log Alert resource:
import * as types from 'types.bicep'

param logAlert types.logAlert

func returnIso8601(minutes int) string => minutes > 1440 ? 'P${minutes/1440}D' : minutes < 60 ? 'PT${minutes}M': 'PT${minutes/60}H'

resource identity 'Microsoft.ManagedIdentity/userAssignedIdentities@2023-07-31-preview' existing = if (contains(logAlert, 'identity') ? logAlert.?identity.type == 'UserAssigned' : false ) {
  name: logAlert.?identity.name
  scope: resourceGroup(logAlert.?identity.?subscriptionId ?? subscription().subscriptionId, logAlert.?identity.resourceGroupName)
}

resource resourceGroupResource 'Microsoft.Resources/resourceGroups@2025-04-01' existing = if (logAlert.scope.type == 'ResourceGroup') {
  name: logAlert.scope.resourceGroupName
  scope: subscription(logAlert.scope.?subscriptionId ?? subscription().subscriptionId)
}

resource logAnalyticsWorkspace 'Microsoft.OperationalInsights/workspaces@2020-08-01' existing = if (logAlert.scope.type == 'LogAnalyticsWorkspace') {
  name: logAlert.scope.name
  scope: resourceGroup(logAlert.scope.?subscriptionId ?? subscription().subscriptionId, logAlert.scope.resourceGroupName)
}

resource applicationInsights 'Microsoft.Insights/components@2020-02-02' existing = if (logAlert.scope.type == 'ApplicationInsights') {
  name: logAlert.scope.name
  scope: resourceGroup(logAlert.scope.?subscriptionId ?? subscription().subscriptionId, logAlert.scope.resourceGroupName)
}

resource actionGroups 'Microsoft.Insights/actionGroups@2024-10-01-preview' existing = [for actionGroup in logAlert.?actionGroups ?? []: {
  name: actionGroup.name
  scope: resourceGroup(actionGroup.?subscriptionId ?? subscription().subscriptionId, actionGroup.resourceGroupName)
}]

resource logAlertResource 'Microsoft.Insights/scheduledQueryRules@2025-01-01-preview' = {
  name: logAlert.name
  location: resourceGroup().location
  tags: logAlert.?tags ?? {}
  identity: {
    type: logAlert.?identity.type ?? 'None'
    userAssignedIdentities: contains(logAlert, 'identity') ? logAlert.?identity.type == 'UserAssigned' ? {
      '${identity.id}': {}
    } : null : null
   }
  kind: logAlert.type == 'LogAlertStaticThreshold' || logAlert.type == 'LogAlertDynamicThreshold'
    ? 'LogAlert'
    // SimpleLogAlert case
    : 'SimpleLogAlert'
  properties: {
    displayName: logAlert.displayName
    description: logAlert.?description ?? null
    enabled: logAlert.?enabled ?? true
    autoMitigate: logAlert.?autoMitigate ?? false
    severity: logAlert.severity
    evaluationFrequency: logAlert.type == 'SimpleLogSearchAlert' ? null : returnIso8601(logAlert.?frequencyInMinutes ?? 15)
    windowSize: logAlert.type == 'SimpleLogSearchAlert' ? null : returnIso8601(logAlert.?windowSizeInMinutes ?? 15)
    overrideQueryTimeRange: contains(logAlert, 'overrideQueryTimeRangeInMinutes')
      ? returnIso8601(logAlert.overrideQueryTimeRangeInMinutes)
      : null
    muteActionsDuration: contains(logAlert, 'muteActionsDurationInMinutes')
      ? returnIso8601(logAlert.muteActionsDurationInMinutes)
      : null
    scopes: [
      logAlert.scope.type == 'ResourceGroup'
        ? resourceGroupResource.id
        : logAlert.scope.type == 'LogAnalyticsWorkspace'
          ? logAnalyticsWorkspace.id
          : logAlert.scope.type == 'ApplicationInsights'
            ? applicationInsights.id
            // Subscription scope type
            : '/subscriptions/${logAlert.scope.?subscriptionId ?? subscription().subscriptionId}'
    ]
    criteria: {
      allOf: [
        {
          criterionType: logAlert.type == 'LogAlertStaticThreshold'
            ? 'StaticThresholdCriterion'
            : logAlert.type == 'LogAlertDynamicThreshold'
              ? 'DynamicThresholdCriterion'
              : null
          query: logAlert.query
          timeAggregation: logAlert.type == 'SimpleLogSearchAlert' ? null : logAlert.timeAggregation
          metricMeasureColumn: logAlert.type == 'SimpleLogSearchAlert'
            ? null
            : logAlert.metricMeasureColumn =~ 'TableRows'
              ? null
              : logAlert.metricMeasureColumn
          operator: logAlert.type == 'SimpleLogSearchAlert' ? null : logAlert.operator
          threshold: logAlert.type == 'SimpleLogSearchAlert' ? null : logAlert.?threshold ?? null
          alertSensitivity: logAlert.type == 'SimpleLogSearchAlert'
            ? null
            : logAlert.?thresholdSensitivity ?? null
          minRecurrenceCount: logAlert.type == 'SimpleLogSearchAlert'
            ? logAlert.?minRecurrenceCount
            : null
          ignoreDataBefore: logAlert.type == 'SimpleLogSearchAlert'
            ? null
            : logAlert.?ignoreDataBefore ?? null
          resourceIdColumn: logAlert.type == 'SimpleLogSearchAlert'
            ? null
            : contains(logAlert, 'resourceIdColumn')
              ? logAlert.?resourceIdColumn ?? null
              : logAlert.scope.type == 'ResourceGroup' || logAlert.scope.type == 'Subscription'
                ? '_ResourceId'
                : null
          failingPeriods: logAlert.type == 'SimpleLogSearchAlert'
            ? null
            : {
              minFailingPeriodsToAlert: logAlert.?minFailingPeriodsToAlert ?? 1
              numberOfEvaluationPeriods: logAlert.?numberOfEvaluationPeriods ?? 1
            }
          dimensions: logAlert.type == 'SimpleLogSearchAlert' ? null : logAlert.?dimensions ?? []
        }
      ]
    }
    checkWorkspaceAlertsStorageConfigured: logAlert.?checkWorkspaceAlertsStorageConfigured ?? false
    skipQueryValidation: logAlert.?skipQueryValidation ?? false
    actions: {
      actionGroups: [for (actionGroup, index) in logAlert.?actionGroups ?? []: actionGroups[index].id]
      actionProperties: logAlert.?actionProperties ?? {}
      customProperties: logAlert.?customProperties ?? {}
    }
  }
}
As you can see, this code has many conditions and uses different functions, so there are many things that need to be tested to ensure they work correctly. Note also the usage of the user-defined function returnIso8601() which has its own logic and sub-cases to be tested.
Now that we have the code we need Bicep parameters file. Bicep Snapshots work with that file in order to generate the JSON. We can have the following file as example:
using 'main.bicep'

param logAlerts = [
  {
    name: 'logAlert001'
    type: 'LogAlertStaticThreshold'
    displayName: 'Log Alert 001'
    severity: 3
    scope: {
      type: 'LogAnalyticsWorkspace'
      name: 'workspace001'
      resourceGroupName: 'kusto'
      subscriptionId: '11111111-1111-1111-1111-111111111111'
    }
    query: 'Perf'
    timeAggregation: 'Average'
    operator: 'GreaterThan'
    threshold: '0.5'
    metricMeasureColumn: 'CounterValue'
  }
  {
    name: 'logAlert002'
    type: 'LogAlertDynamicThreshold'
    displayName: 'Log Alert 002'
    severity: 2
    scope: {
      resourceGroupName: 'identities'
      type: 'ResourceGroup'
    }
    query: 'AzureActivity'
    timeAggregation: 'Count'
    metricMeasureColumn: 'TableRows'
    operator: 'GreaterThan'
    thresholdSensitivity: 'Low'
  }
  {
    name: 'logAlert003'
    displayName: 'Log Alert 003'
    type:'SimpleLogSearchAlert'
    severity: 4
    minRecurrenceCount: 5
    scope: {
      name: 'workspace001'
      resourceGroupName: 'kusto'
      subscriptionId: '11111111-1111-1111-1111-111111111111'
      type: 'LogAnalyticsWorkspace'
    }
    query: 'AzureActivity'
    identity: {
      name: 'identity1'
      resourceGroupName: 'identities'
      type: 'UserAssigned'
    }
  }
]
You will notice that I have 3 different types of alerts. More entries (alerts) can be added that represent other scenarios (cases). Note that many of the values in the parameters are made up, like the subscription ID. Those do not need to be valid as I am doing the testing locally. This makes it easier to come up with different test scenarios by just using different input. Snapshot commands are run in two different modes. Mode overwrite – generates a JSON file that contains the resources as they will be deployed to Azure. Mode validate – validates the generated JSON file via overwrite mode by showing differences in what-if format. So in PowerShell we execute the following command to first generate the JSON:
& bicep snapshot "parameters.bicepparam" --subscription-id 00000000-0000-0000-0000-000000000000 --resource-group alerts --location westeurope --mode overwrite
Once executed the following JSON file is generated:
{
  "predictedResources": [
    {
      "id": "/subscriptions/00000000-0000-0000-0000-000000000000/resourceGroups/alerts/providers/Microsoft.Insights/scheduledQueryRules/logAlert001",
      "type": "Microsoft.Insights/scheduledQueryRules",
      "name": "logAlert001",
      "apiVersion": "2025-01-01-preview",
      "location": "westeurope",
      "kind": "LogAlert",
      "identity": {
        "type": "None",
        "userAssignedIdentities": null
      },
      "tags": {},
      "properties": {
        "displayName": "Log Alert 001",
        "description": null,
        "enabled": true,
        "autoMitigate": false,
        "severity": 3,
        "evaluationFrequency": "PT15M",
        "windowSize": "PT15M",
        "overrideQueryTimeRange": null,
        "muteActionsDuration": null,
        "scopes": [
          "/subscriptions/11111111-1111-1111-1111-111111111111/resourceGroups/kusto/providers/Microsoft.OperationalInsights/workspaces/workspace001"
        ],
        "criteria": {
          "allOf": [
            {
              "criterionType": "StaticThresholdCriterion",
              "query": "Perf",
              "timeAggregation": "Average",
              "metricMeasureColumn": "CounterValue",
              "operator": "GreaterThan",
              "threshold": "0.5",
              "alertSensitivity": null,
              "minRecurrenceCount": null,
              "ignoreDataBefore": null,
              "resourceIdColumn": null,
              "failingPeriods": {
                "minFailingPeriodsToAlert": 1,
                "numberOfEvaluationPeriods": 1
              },
              "dimensions": []
            }
          ]
        },
        "checkWorkspaceAlertsStorageConfigured": false,
        "skipQueryValidation": false,
        "actions": {
          "actionGroups": [],
          "actionProperties": {},
          "customProperties": {}
        }
      }
    },
    {
      "id": "/subscriptions/00000000-0000-0000-0000-000000000000/resourceGroups/alerts/providers/Microsoft.Insights/scheduledQueryRules/logAlert002",
      "type": "Microsoft.Insights/scheduledQueryRules",
      "name": "logAlert002",
      "apiVersion": "2025-01-01-preview",
      "location": "westeurope",
      "kind": "LogAlert",
      "identity": {
        "type": "None",
        "userAssignedIdentities": null
      },
      "tags": {},
      "properties": {
        "displayName": "Log Alert 002",
        "description": null,
        "enabled": true,
        "autoMitigate": false,
        "severity": 2,
        "evaluationFrequency": "PT15M",
        "windowSize": "PT15M",
        "overrideQueryTimeRange": null,
        "muteActionsDuration": null,
        "scopes": [
          "/subscriptions/00000000-0000-0000-0000-000000000000/resourceGroups/identities"
        ],
        "criteria": {
          "allOf": [
            {
              "criterionType": "DynamicThresholdCriterion",
              "query": "AzureActivity",
              "timeAggregation": "Count",
              "metricMeasureColumn": null,
              "operator": "GreaterThan",
              "threshold": null,
              "alertSensitivity": "Low",
              "minRecurrenceCount": null,
              "ignoreDataBefore": null,
              "resourceIdColumn": "_ResourceId",
              "failingPeriods": {
                "minFailingPeriodsToAlert": 1,
                "numberOfEvaluationPeriods": 1
              },
              "dimensions": []
            }
          ]
        },
        "checkWorkspaceAlertsStorageConfigured": false,
        "skipQueryValidation": false,
        "actions": {
          "actionGroups": [],
          "actionProperties": {},
          "customProperties": {}
        }
      }
    },
    {
      "id": "/subscriptions/00000000-0000-0000-0000-000000000000/resourceGroups/alerts/providers/Microsoft.Insights/scheduledQueryRules/logAlert003",
      "type": "Microsoft.Insights/scheduledQueryRules",
      "name": "logAlert003",
      "apiVersion": "2025-01-01-preview",
      "location": "westeurope",
      "kind": "SimpleLogAlert",
      "identity": {
        "type": "UserAssigned",
        "userAssignedIdentities": {
          "/subscriptions/00000000-0000-0000-0000-000000000000/resourceGroups/identities/providers/Microsoft.ManagedIdentity/userAssignedIdentities/identity1": {}
        }
      },
      "tags": {},
      "properties": {
        "displayName": "Log Alert 003",
        "description": null,
        "enabled": true,
        "autoMitigate": false,
        "severity": 4,
        "evaluationFrequency": null,
        "windowSize": null,
        "overrideQueryTimeRange": null,
        "muteActionsDuration": null,
        "scopes": [
          "/subscriptions/11111111-1111-1111-1111-111111111111/resourceGroups/kusto/providers/Microsoft.OperationalInsights/workspaces/workspace001"
        ],
        "criteria": {
          "allOf": [
            {
              "criterionType": null,
              "query": "AzureActivity",
              "timeAggregation": null,
              "metricMeasureColumn": null,
              "operator": null,
              "threshold": null,
              "alertSensitivity": null,
              "minRecurrenceCount": 5,
              "ignoreDataBefore": null,
              "resourceIdColumn": null,
              "failingPeriods": null,
              "dimensions": null
            }
          ]
        },
        "checkWorkspaceAlertsStorageConfigured": false,
        "skipQueryValidation": false,
        "actions": {
          "actionGroups": [],
          "actionProperties": {},
          "customProperties": {}
        }
      }
    }
  ],
  "diagnostics": []
}
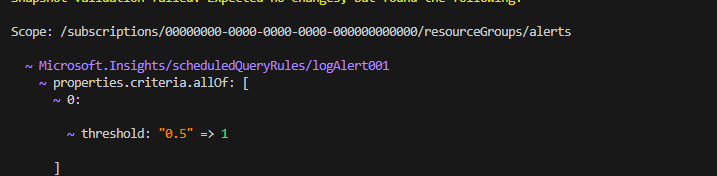
You can see the resources the way they will appear if deployed as Azure resources. So even before deploying to Azure you can easily verify if the intended input matches the end result. If I run snapshot validate now it will not show any differences so let’s change the threshold of the first alert from 0.5 to 1 and run validate:
& bicep snapshot "parameters.bicepparam" --subscription-id 00000000-0000-0000-0000-000000000000 --resource-group alerts --location westeurope --mode validate
You will get a result like this:
As you can see, this looks exactly like a what-if format result. If you make more changes in the parameters file you will see those changes as well. Note that if you change the name of one of the alert rules it will mark that change in a way where the previous resource will be removed and the new one added, in the same way as on Azure, since the name is part of the resource ID and it must be unique with no option of changing it. This is one way to use Bicep Snapshots but there is another one. If we have the same bicep parameters file but we are making changes to the code itself. This simulates a case where, for example, we are developing the module further and we want to test our new changes, or if we are using the bicep parameters file with a new version of the module. To simulate a change, I will change lines 90 to 92 in log-alert.bicep from:
minRecurrenceCount: logAlert.type == 'SimpleLogSearchAlert'
 ? logAlert.?minRecurrenceCount
 : null
to:
minRecurrenceCount: logAlert.type == 'SimpleLogSearchAlert'
 ? null
 : logAlert.?minRecurrenceCount
Basically reverting the logic on the property. It is not an actual change that I am going to make but let’s say I have made a mistake and I will use the validate mode to test how that change will reflect:
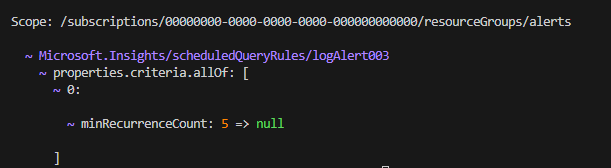
You can see this will change the property on the simple log alert. Of course here it does not throw any error and it will not throw an error even if deployed on Azure, but it makes that property not configurable for the simple log alert type. Note that snapshots will not catch any errors that can be validated only when the actual resource is deployed on Azure. For example, if you change the kind property from LogAlert to LogAlert2 this will be shown as a change via snapshots validate mode and it will not throw an error, but when deployed on Azure the deployment will fail with an error that such kind is not supported.
In summary there are two ways to use Bicep Snapshots:
- Testing your input (bicep parameter files) before initial deployment or after when making changes. Even if you do not have such deep knowledge in Bicep and you are re-using modules from different sources you can test any changes when adopting new versions of those modules. Note that even a change in the API version used will be shown.
- Testing during development. If you are testing code changes you can easily verify if the change you are doing will somehow impact existing deployments. You will generate JSON with the previous module version and use validate to verify if the code changes do not change the behavior for existing deployments. Even when adding completely new functionality that you know will not impact existing deployments, you can use it to validate if the code applied is the one expected. Often during development there are typos or the logic is not correct. If you try to fix these issues with deployment on Azure each time, it takes a lot longer than just running the snapshot command. This can save you time to polish your code before doing final testing on Azure. A third use case is to find bugs and fix them. Often the logic in code might not be complete and may have some bugs. You can use snapshots to see differences in different input without having to deploy actual Azure resources. This can reduce the time to find the bug and the time to fix it.
Note that recently Bicep Console feature was also released in preview. That feature overlaps some of the functionality of Bicep Snapshots but not completely. It overlaps in terms of testing, but I think for now Bicep Console is more suited for testing small parts of the code rather than a whole template or module.
When you think of Bicep snapshots you should think of it like local what-if, as the functionality available is exactly what you have with what-if in Azure. They are based on the same code. With that in mind, keep in mind that sometimes there are limits in what-if and certain usage of code and functions might result in filling the value of the property as ARM template code rather than the end result when deployed to Azure. In such cases you either have to change the code to overcome this or accept that you will not be able to test that part of your code. You can always try to use Bicep console functionality to replicate that logic to some extent and test it there.
I encourage you to use the example to test the feature on your own by adding more input cases and changing logic in the code to see how that will affect them. This will help you understand the feature, find any issues, and start adopting it for your own work. The examples can be found at GitHub.
I hope this was an interesting and insightful topic for you.

One thought on “Azure Bicep Snapshots – Test and Validate Your Code and Deployments”