Azure Front Door is a global, scalable service that acts as a content delivery network (CDN) and application load balancer to improve application performance and availability. The way you expose application on Azure FD is by creating origins. For each origin you have to add one or more origins. When configuring the origin you have the option to configure health probe. The health probe makes sure the origins are up. If an origin is not up it will traffic will not be sent to it. The results from the health probes is visible via OriginHealthPercentage metric. Now let’s have a closer look to metric OriginHealthPercentage as the results from it might be a little bit confusing, especially when you send the metric to Log Analytics workspace and viewed there.
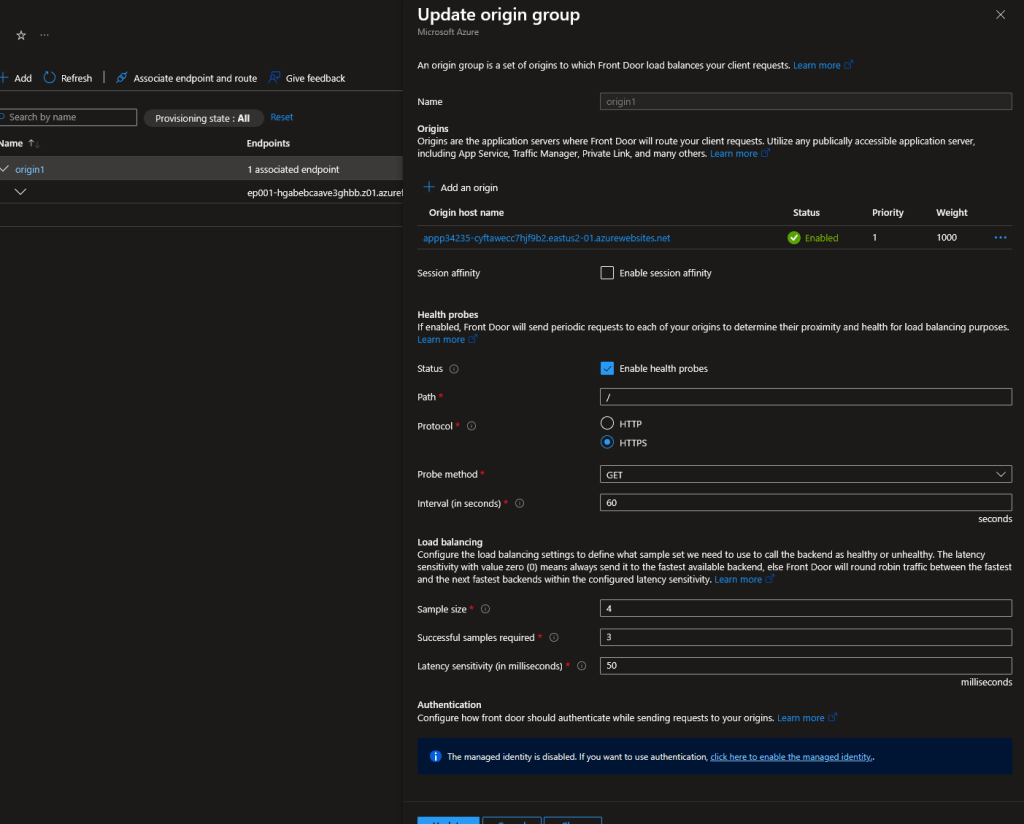
First let’s look at my Front Door Origins configuration. I have single origin group and with single origin and health probes that runs every 60 seconds.
Let’s see the results of the metric:
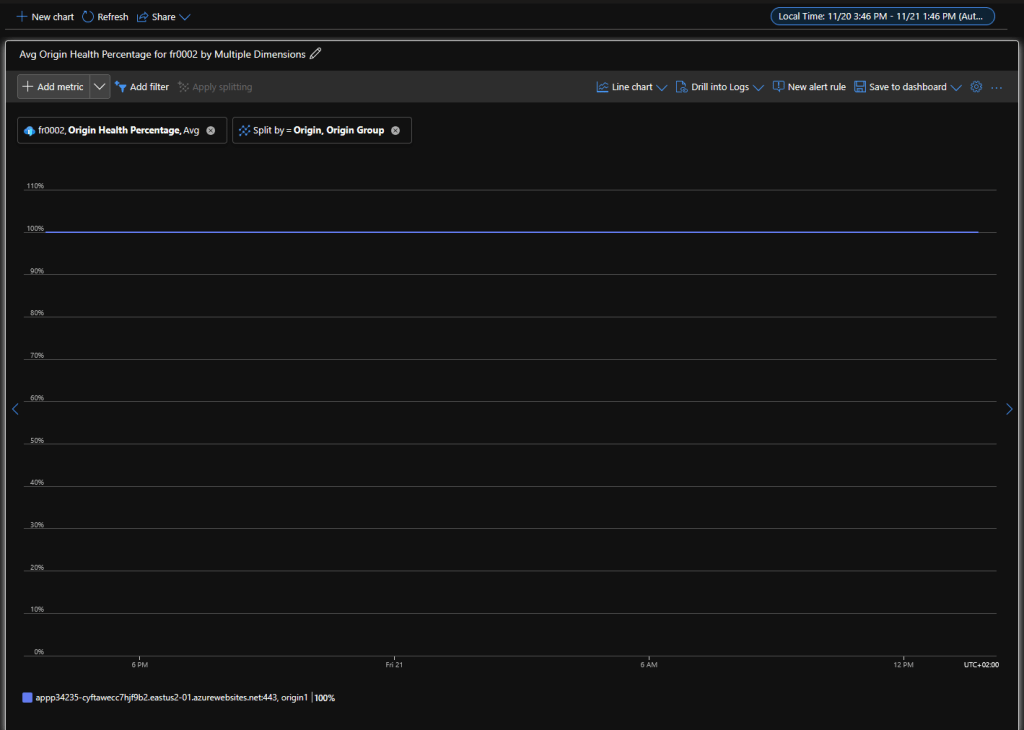
Note that I have configured the view to show results per origin group and origin. If you have more origin groups or origin you will see results for them as well. In my case all the origin is healthy. The percentage of health is with average aggregation as you can see. Let’s also look the same metric but with Count aggregation. I have also selected shorter period of time and time granularity of 1 minute which is my interval for the health probe:
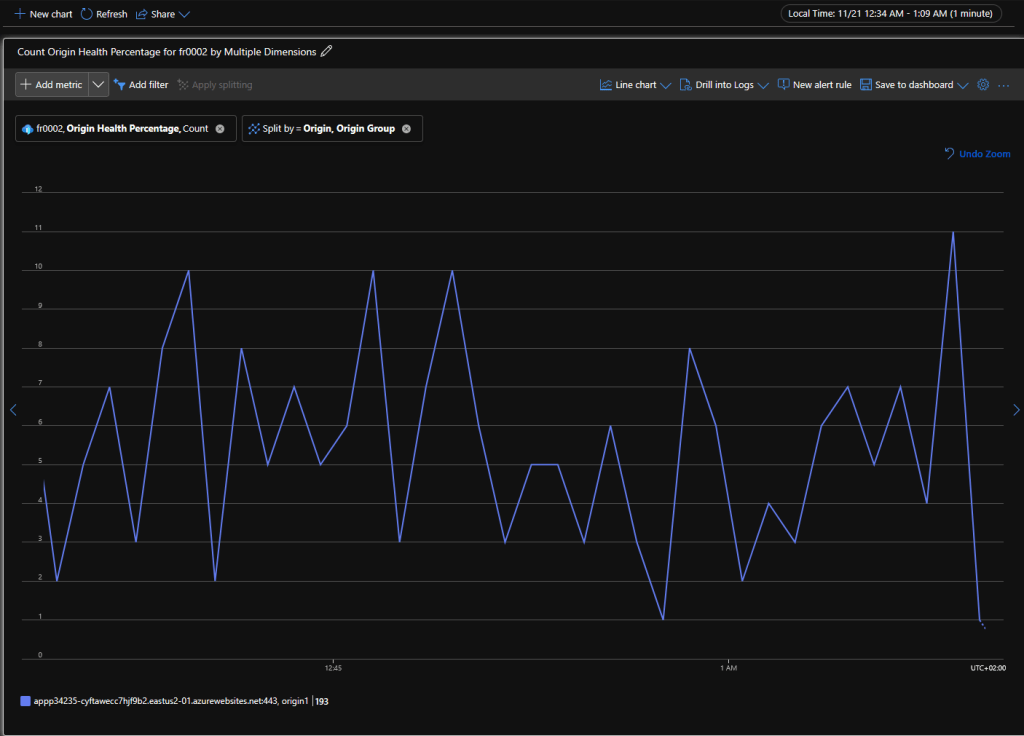
May be you are seeing something that you haven’t expected as I have count ranging from 3 to 10. You were most likely expecting a single probe every minute (1 count flat). We can actually find the reason for this behavior in health probe documentation:
Since each Azure Front Door edge location is sending health probes to your origins, the health probe volume for your origins can be high. The number of probes depends on your customer’s traffic location and your health probe frequency. If the Azure Front Door edge locations don’t receive real traffic from your end users, the frequency of the health probe from the edge location is decreased from the configured frequency. If there’s traffic to all the Azure Front Door edge locations, the health probe volume can be high depending on your health probes frequency.
An example to roughly estimate the health probe volume per minute to an origin when using the default probe frequency of 30 seconds. The probe volume on each of your origin is equal to the number of edge locations times two requests per minute. The probing requests are less if there’s no traffic sent to all of the edge locations. For a list of edge locations, see edge locations by region.
In short Azure Front Door is global service and sends multiple health probes from different edge locations. On top of that the number of probes depends on your traffic.
Something that I cannot explain are the results For Sum aggregation:
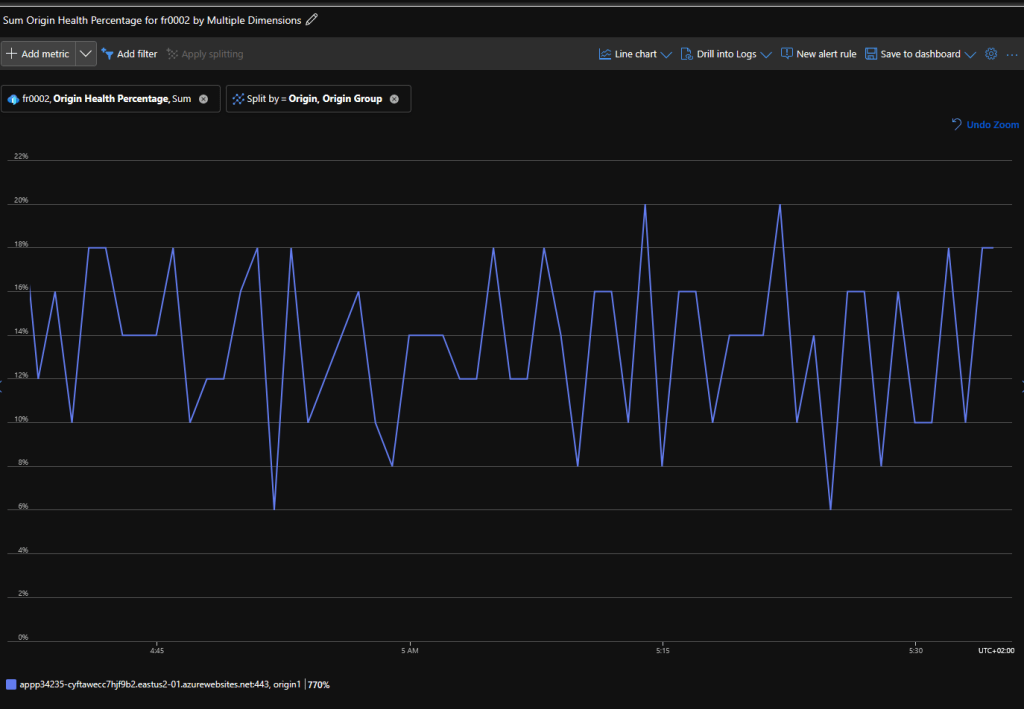
If my health probe is always 100% the values for sum should always be some value above 100%. For example, if for particular time interval (1 minute) I have 3 health probes (count 3) and all return 100% the sum for that interval should be 300% and not something like 12%. For me this is some kind of a bug but may be it is the same of some other values rather the health percentage.
Let’s look at something even weirder with the metric when it is send to Log Analytics workspace. First I have to make a note that the dimensions of the metrics (in this case origin group and origin) are not send to Log Analytics so you will see the data for the metric without breaking it down to the dimensons. This limitation allow makes the OriginHealthPercentage useless for use in Log Analytics except if you do not have a single origin group. Metrics export via DCRs aims to solve this problem but FD is not one of the supported services yet. To view the metric in Log Analytics we can use the query below:
AzureMetrics
| where ResourceProvider == "MICROSOFT.CDN"
| where MetricName == "OriginHealthPercentage"
| project TimeGenerated, Total, Count, Average, Minimum, Maximum
I only have one FD so I do not need to see all other data:
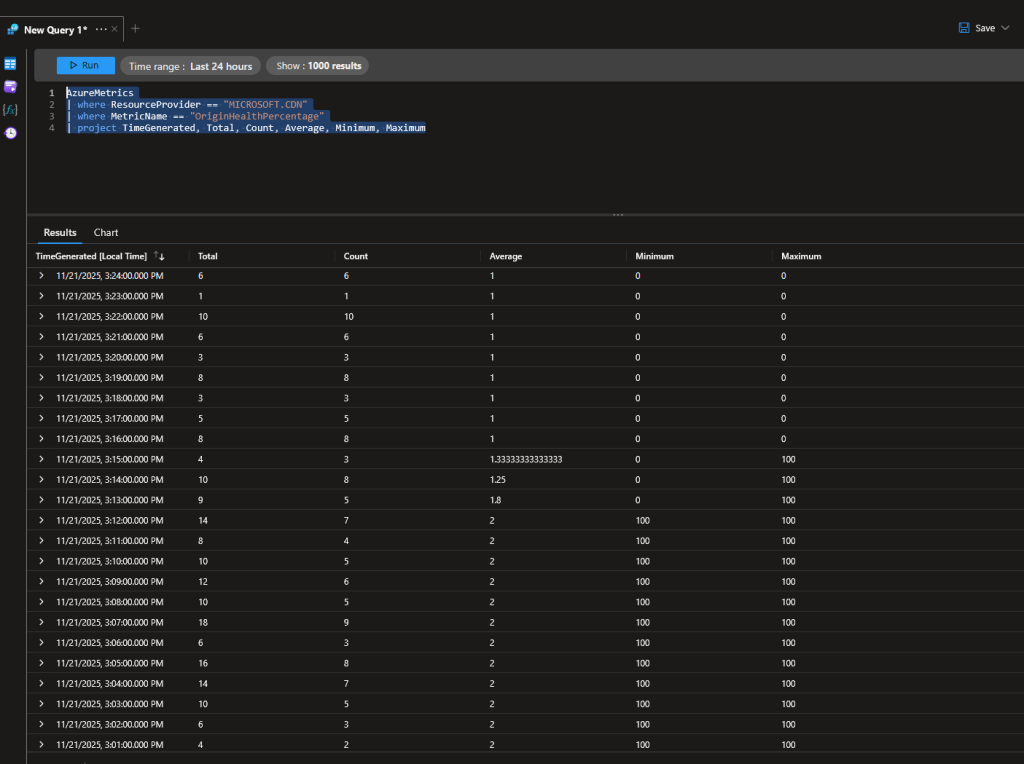
I have picked data where the origin is 100% healthy and becomes unhealthy (0%). As you can see data like Total (Sum in metrics explorer) and Count matches what we see in Metrics explorer. Of course you will notice that is not the same with Average. Instead of average showing 100 or 0 it shows some values between 1 and 2. So where the average value comes from? If you look closely the Average value is the result of dividing Total by Count. This for sure is a bug and it has been that way most likely from the FD initial release. The values for Minimum and Maximum seems to be correct so in case you want to use the data in Log Analytics I would suggest you to use Minimum value to determine if there is something unhealthy in the FD instance instead of Average. Overall you should metric alerts with dimension at least Origin group.
I hope this was useful blog post for you!

One thought on “Do not use Azure Front Door metric OriginHealthPercentage in Log Analytics”